
In 2023, the number of marriages and divorces within the United States is declining, but why?
We’re going to look over all the U.S. Census Bureau’s data on relationships to see how much of a hit the national marriage and divorce rates have taken over the past 10-15 years. Then we’ll draw some conclusions as to why these rates have waned over time and establish predictions on where we might be headed. We’ll even include a breakdown of the marriage and divorce rates by state and see how these compare to the national trends.
Where Did We Get Our Data and Research?
Our data comes from the U.S. Census Bureau (USCB), which is responsible for compiling and putting out data on United States citizens and the economy. The Census Bureau is the primary agency of the U.S. Federal Statistical System. Every ten years, the Census Bureau counts the American people, discovering how many people live in the country and where. The information is used to make appropriate decisions on building and maintaining infrastructure across the country, including hospitals, police/fire departments, public schools, and transportation.
Because the U.S. Census takes place every ten years (always on years ending in “0,” like 2000, 2010, or 2020), the information we’ve provided in this analysis makes comparisons on marriage and divorce rates in 2009 and 2019, respectively. Information from 2009 captures data recorded during the 2000 Census, and information from 2019 captures data recorded during the 2010 Census.
National Marriage and Divorce Rates
Let’s get into the data and numbers the U.S. Census Bureau posted on its official website: www.census.gov.
Data on the national marriage and divorce rates appear on the same page and compare the trends recorded for the 2000 and 2010 Censuses. According to the Census Bureau, marriages and divorces in America have dropped between 2009 and 2019.
U.S. Marriage and Divorce Rates Declines in the Last 10 Years
Key Findings
- 2,231,263 women married in the last year (2019).
- In 2019, there were 137,091,567 women aged 15 or older.
- The national marriage rate 2019 was 16.3 for every 1,000 women over 15.
- The national divorce rate in the U.S. for 2019 was 7.6 for every 1,000 women over the age of 15.
- In 2009, the marriage rate was 17.6 for every 1,000 women over the age of 15, and the divorce rate was 9.7 for every 1,000 women over the age of 15.
- As of 2019, the U.S. national marriage rate is down by 1.3%, and the national divorce rate is down by 2.1%.

Why Are the Estimates Only Shown for Women?
Before we address the key findings of the study, it’s important to point out that these studies focused on women who were married or divorced within the last year. The numbers here are for every 1,000 women who were 15 or older.
For a better understanding of why they chose to focus only on women for this study, the Census Bureau provided the following explanation:
“While the Census Bureau publishes estimates for both men and women, we have restricted this visualization to data for women since the intention is to provide a digestible look at trends in marriage and divorce. Historically, women’s data have often been presented when a choice needs to be made. Previous research found that women more often report data for themselves and report their marital history more accurately.”
Marriage Rates on the State Level
The U.S. Census Bureau shows that fewer people are getting married and divorced nowadays than they did ten years ago. It’s reasonable to assume that divorce rates are down because fewer people are getting married in the first place. So why are fewer people getting married?
We’ll address this in due time and give you some of the top reasons we feel that the U.S. marriage rates have been dropping off in the last ten years, but first, we want to take you through the marriage and divorce rate information on the U.S. Census Bureau has provided for each state.
States with Marriage Rates Over National Average

There were only nine states in total that came in over the national marriage rate average in 2019. They ranged from 1.9-6.0 more marriages than the national average of 16.3 per 1,000 women.
- Most states with a marriage rate higher than the national average were in the western half of the country, on the other side of the Mississippi River, except Maine.
- Colorado and Washington were tied for second place.
- Wyoming won by a long shot, with 22.3 marriages per 1,000 women, beating the national marriage rate average by six whole points!
- The District of Columbia has a marriage rate of 21.9 per 1,000 women, 5.1 marriages more than the national average! If it were on the list above, it would place 2nd!
States with Marriage Rates Over National Average
| State | Marriage Rate | Difference From National Avg. |
Wyoming | 22.3 (Per 1,000 Women) | 6.0 more marriages (Per 1,000 women over 15 years) |
Colorado + Washington | 20.9 (Per 1,000 Women) | 4.6 more marriages (Per 1,000 women over 15 years) |
Utah | 20.7 (Per 1,000 Women) | 4.4 more marriages (Per 1,000 women over 15 years) |
Maine | 20.0 (Per 1,000 Women) | 3.7 more marriages (Per 1,000 women over 15 years) |
Oklahoma | 19.5 (Per 1,000 Women) | 3.2 more marriages (Per 1,000 women over 15 years) |
Nebraska | 18.8 (Per 1,000 Women) | 2.5 more marriages (Per 1,000 women over 15 years) |
Missouri | 18.3 (Per 1,000 Women) | 2.0 more marriages (Per 1,000 women over 15 years) |
Texas | 18.2 (Per 1,000 Women) | 1.9 more marriages (Per 1,000 women over 15 years) |
States with the Lowest Marriage Rates
Ten states had statistically lower marriage rates than the national average of 16.3 per every 1,000 women. These states ranged anywhere from 0.8-4.6 fewer marriages compared to the national average.
- A high concentration of states in the Northeast fell into this category.
- High-population states (California, New York, Florida, and Pennsylvania) experienced some of the lowest marriage rates anywhere in the country.
- Puerto Rico also has marriage rates lower than the national average (7.8 per 1,000 women and 8.5 fewer marriages) and marriage rates lower than Delaware.
States with Marriage Rates Under National Average
| State | Marriage Rate | Difference From National Avg. |
Delaware | 11.7 (Per 1,000 Women) | 4.6 fewer marriages (Per 1,000 women over 15 years) |
Connecticut + Rhode Island | 12.4 (Per 1,000 Women) | 3.9 fewer marriages (Per 1,000 women over 15 years) |
Vermont | 12.5 (Per 1,000 Women) | 3.8 fewer marriages (Per 1,000 women over 15 years) |
New Jersey | 14.0 (Per 1,000 Women) | 2.3 fewer marriages (Per 1,000 women over 15 years) |
Louisiana | 14.1 (Per 1,000 Women) | 2.2 fewer marriages (Per 1,000 women over 15 years) |
New York | 14.3 (Per 1,000 Women) | 2.0 fewer marriages (Per 1,000 women over 15 years) |
Pennsylvania | 15.0 (Per 1,000 Women) | 1.3 fewer marriages (Per 1,000 women over 15 years) |
Florida | 15.2 (Per 1,000 Women) | 1.1 fewer marriages (Per 1,000 women over 15 years) |
California | 15.5 (Per 1,000 Women) | 0.8 fewer marriages (Per 1,000 women over 15 years) |
Highest Marriage Rate Increases
While there were several states whose marriage rates remained the same over the 2010s, only two saw an increase!
| State | Marriage Rate Increase |
Maine | 7.8% |
Minnesota | 2.3% |
States Where the Marriage Rates Remained the Same
These states saw neither an increase nor a decrease in their marriage rates between 2009 and 2019. There are 26 altogether, which means that just over half of the U.S. states maintained the same number of marriages that they did ten years ago.
- Colorado
- Florida
- Illinois
- Kansas
- Maryland
- Massachusetts
- Michigan
- Mississippi
- Missouri
- Montana
- Nebraska
- New Hampshire
- New Jersey
- New York
- Ohio
- Oregon
- Pennsylvania
- Rhode Island
- South Carolina
- South Dakota
- Tennessee
- Vermont
- Virginia
- Washington
- Wisconsin
- Wyoming
Highest Marriage Rate Decreases
Twenty-two states saw drop-offs in their marriage rates between 2009 and 2019. Delaware saw the most significant decline in their marriage rate: 9.2%. This is also the state with the lowest marriage rate in the nation: 11.7 marriages per 1,000 women (4.6 lower than the national average).
| State | Marriage Rate Decrease |
| Delaware | 9.2% |
| North Dakota | 7.8% |
| Alaska | 7.0% |
| Arkansas | 6.5% |
| Hawaii | 6.4% |
| Idaho | 6.2% |
| Utah | 6.0% |
| Iowa | 5.9% |
| New Mexico | 5.7% |
| West Virginia | 5.2% |
| Nevada | 4.6% |
| Alabama | 3.6% |
| Connecticut/Louisiana | 3.5% |
| Arizona/Kentucky | 3.4% |
| North Carolina | 3.2% |
| Georgia | 3.1% |
| Oklahoma | 2.9% |
| Texas | 2.2% |
| California/Indiana | 2.0% |
Divorce Rates on the State Level
Just as marriage rates are declining in the United States in 2023, divorce rates are dropping off, too, because fewer people are getting married. But that doesn’t mean that divorce rates are down in every state. There are quite a few states where the divorce rates are up, despite the national environment. We’ll look at divorce rates, state by state.
States with the Highest Divorce Rates
Even though divorces are down as a whole in the United States, there are ten states where the divorce rate was higher than the national average in 2019. Remember that the national divorce rate in the U.S. in 2019 was 7.6 per 1,000 women.
- Arkansas has the highest divorce rate in the U.S., with 3.1 more divorces per 1,000 than the national average of 7.6 per 1,000.
- Alabama and Missouri tied for 6th place on the list, with 9.1 divorces per 1,000 women.

States with Divorce Rates Over National Average
| State | Divorce Rate | Difference From National Avg. |
Arkansas | 10.7 (Per 1,000 Women) | 3.1 more divorces (Per 1,000 women over 15 years) |
Oklahoma | 10.4 (Per 1,000 Women) | 2.8 more divorces (Per 1,000 women over 15 years) |
Nevada | 10.2 (Per 1,000 Women) | 2.6 more divorces (Per 1,000 women over 15 years) |
Kentucky | 10.1 (Per 1,000 Women) | 2.5 more divorces (Per 1,000 women over 15 years) |
Utah | 9.4 (Per 1,000 Women) | 1.8 more divorces (Per 1,000 women over 15 years) |
Alabama + Missouri | 9.1 (Per 1,000 Women) | 1.5 more divorces (Per 1,000 women over 15 years) |
Indiana | 9.0 (Per 1,000 Women) | 1.4 more divorces (Per 1,000 women over 15 years) |
Georgia | 8.9 (Per 1,000 Women) | 1.3 more divorces (Per 1,000 women over 15 years) |
Texas | 8.6 (Per 1,000 Women) | 1.0 more divorces (Per 1,000 women over 15 years) |
States with the Lowest Divorce Rates
Ten states in 2019 had lower divorce rates than the national average of 7.6 per 1,000 women. Maine experienced the lowest number of divorces and topped the list with a rate of 4.8 divorces per 1,000 women, a difference of 2.8 divorces from the overall U.S. rate.
- Arkansas has the highest divorce rate in the U.S., with 3.1 more divorces per 1,000 than the national average of 7.6 per 1,000.
- Alabama and Missouri tied for 6th place on the list, with 9.1 divorces per 1,000 women.
States with Divorce Rates Under National Average
| State | Divorce Rate | Difference From National Avg. |
Maine | 4.8 (Per 1,000 Women) | 2.8 fewer divorces (Per 1,000 women over 15 years) |
New York + Pennsylvania | 6.1 (Per 1,000 Women) | 1.5 fewer divorces (Per 1,000 women over 15 years) |
Illinois | 6.2 (Per 1,000 Women) | 1.4 fewer divorces (Per 1,000 women over 15 years) |
Iowa + New Jersey | 6.3 (Per 1,000 Women) | 1.3 fewer divorces (Per 1,000 women over 15 years) |
Massachusetts + Wisconsin | 6.4 (Per 1,000 Women) | 1.2 fewer divorces (Per 1,000 women over 15 years) |
California | 6.5 (Per 1,000 Women) | 1.1 fewer divorces (Per 1,000 women over 15 years) |
Minnesota | 6.7 (Per 1,000 Women) | 0.9 fewer divorces (Per 1,000 women over 15 years) |
Source: www.census.gov
Puerto Rico had the lowest divorce rate (4.7 divorces per 1,000 women), coming in ahead of Maine, while the District of Columbia technically tied for 2nd place with Maine at a divorce rate of 4.8 per 1,000 women.
Highest Divorce Rate Increases
According to the U.S. Census Bureau data, no states between 2009 and 2019 saw an increase in their overall divorce rate. However, several states (20) didn’t see any significant changes in their divorce rates, at least not any changes that the Census Bureau felt were worth mentioning.
US States with Steady Divorce Rates
- Arkansas
- Delaware
- Hawaii
- Idaho
- Kansas
- Maryland
- Massachusetts
- Minnesota
- Missouri
- Montana
- Nevada
- New Hampshire
- New Jersey
- New Mexico
- North Dakota
- Rhode Island
- South Carolina
- South Dakota
- Utah Wyoming
Highest Divorce Rate Decreases
The other 30 U.S. states not mentioned above all saw significant decreases in the rate of divorce from 2009 to 2019. Alaska saw the most considerable divorce rate decrease at 9.3%, while Wisconsin saw the lowest at 1.1%.
| State | Divorce Rate Decrease |
| Alaska | 9.3% |
| Alabama | 4.8% |
| Vermont | 4.7% |
| Iowa | 4.5% |
| Maine | 4.3% |
| Mississippi | 3.8% |
| Arizona/Oklahoma | 3.7% |
| Connecticut | 3.6% |
| Kentucky/West Virginia | 3.4% |
| Texas | 3.3% |
| Oregon/Tennessee | 3.1% |
| Nebraska | 2.9% |
| Georgia/Washington | 2.8% |
| Louisiana | 2.7% |
| California | 2.4% |
| North Carolina/Virginia | 2.3% |
| Michigan | 1.9% |
| Florida/Illinois | 1.8% |
| Indiana/Ohio | 1.7% |
| Colorado | 1.5% |
| Pennsylvania | 1.3% |
| New York | 1.2% |
| Wisconsin | 1.1% |
What Influences Marriage and Divorce Rates?
Now that we’ve laid out all the data from the U.S. Census Bureau’s official government website, we’ll begin to look at some of the reasons we might be seeing a drop off in both marriage and divorce rates across this country. Remember that the United States currently has around 334 million people. There are roughly 2 million who get married each year, and 750,000 get divorced or separated over the same period.
Age Level
Research has shown that the age you marry can work toward your marriage’s success or detriment. Studies have shown that getting married within specific age ranges can increase or decrease the likelihood of a divorce. It’s not an exact science, but many studies show that the younger you marry, the higher the chances of the union ending in a divorce or separation.

According to a study by LegalJobs:
“The rate of divorce after 10 years is 48% for those who marry before the age of 18.”
They also found that those who marry between 20 and 25 have a 44-60% chance of divorcing. Those marrying after the age of 25 only have a 25% chance of being divorced, and they ultimately concluded that the sweet spot for marrying at the right time is between the ages of 28 and 32.
As we said, this is not a hard and fast rule, but those who marry in their late 20s tend to come out the other end with higher-quality marriages than those who marry in their late teens, early 20s, or mid-20s. The research points to the idea that you have a 50/50 shot at your marriage succeeding if you marry younger than 25.
If these numbers are accurate, the fact that we see marriage and divorce rates dropping across the United States for the past ten or more years could indicate that people are catching on to this trend and putting off marriage until they are older. Or it could be that people keep putting off marriage until they’re older but realize in their late 20s or 30s that they’re content with staying single, which would explain the decrease in the marriage rates across the country.
Education Level
What about your level of education? Can this contribute toward a healthy marriage or get the ball rolling for a nasty divorce? Research indicates that marriages where both partners hold lower levels of education (high school diploma or lower) are more likely to get divorced.
A study done in 2013 by the Bureau of Labor and Statistics claims:
“The chance of a marriage ending in divorce decreases as educational attainment rises: over half of the marriages among people who did not complete high school ended in divorce compared with approximately 30 percent of marriages among the college graduates.”
College graduates are older than high school graduates. We’re talking 17/18 years vs. 22/23 years old. People who complete college are not only older but are, a lot of the time, more mature as they’ve had those extra years to gain different perspectives and new experiences. They’re also more likely to get into a good career path than those who are freshly out of high school with no other type of schooling or vocational training, which can result in a more stable financial scenario.

Occupation or Income Level
Income level, career, and occupation are factors that come into play when discussing marriage and divorce rates. So many divorces come as a result of money problems, after all. It turns out that having enough money and financial stability can help to keep a marriage afloat, even amid other issues.
A study by Wilkinson and Finkbeiner a few years ago shows a correlation between divorce and a low income or jobs that don’t provide enough money to maintain a decent standard of living. Here are the top five professions (10 in total) they found that resulted in the highest and lowest divorce rates:
Highest Divorce Rate Professions
- Dancers (43%)
- Bartenders (38.4%)
- Message Therapists (38.2%)
- Gaming Cage Workers (34.6%)
- Gaming Service Workers (31.3%)
Lowest Divorce Rate Professions
- Farmers (7.63%)
- Podiatrists (6.81%)
- Clergy (5.61%)
- Optometrists (4.01%)
- Agricultural Engineers (1.78%)
As you can see, the lower-paying professionals, the ones that didn’t require a form of higher education, resulted in higher divorce rates. Education, occupation, and income level are all super essential factors that can play into the success of a marriage.
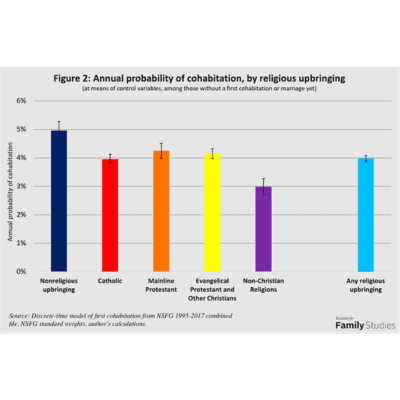
Religious Beliefs
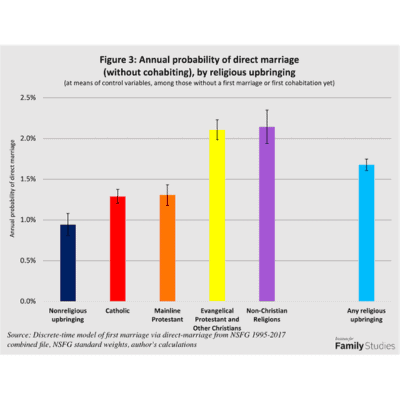
Those who practice religion or believe in God, specifically mainline Christian Evangelical Protestants and non-Christian religions, are more likely to get married (without cohabitation) than those with a Catholic or non-religious upbringing.
Here are some findings from a study by the Institute for Family Studies:
- 2.0-2.5% of Evangelicals and non-Christian religious practitioners are likely to get married without cohabitation.
- The non-religious have a 0.9% chance of marrying, while Catholics and Mainline Protestants have around a 1.3% chance.
But there’s an interesting trend that this study picked up on that suggests the same group that’s quick to marry without cohabitation is the same group that’s likely to get divorced. Yes, Evangelic Protestants are almost as likely to get divorced as those with no religious upbringing. According to this study, these two groups have the highest likelihood of divorce.
Catholics, mainline Protestants, and non-Christian religions are less likely to divorce. So, it seems that religious background impacts marriage and divorce rates, for better or worse. Practicing religion might lead you to marriage earlier in life, but there’s no guarantee that it will shield you from a divorce.
The #MeToo Movement
One of the reasons we could be seeing a drop in marriage rates across the U.S. is due to the impacts on our society due to the #MeToo Movement. Over five years removed from its initial rise, many studies and think pieces on the movement point to the idea that men are more hesitant to approach women or begin a relationship for fear that their advances could be taken the wrong way or used against them.
Evidence For This Trend
- “Men Now Avoid Women at Work” -The Guardian
- “The #MeToo Backlash” -Harvard Business Review
- “#MeToo Has Changed How a Lot of Single Men Behave” -CBS News
- “Are Women Really No Better Off in the Workplace After #MeToo?” – Diversity Jobs
- “Intimidated by #MeToo, Men Have Decided to Step Away” -Columbus Dispatch

It’s interesting to consider as we look at dwindling marriage rates across the country. Traditionally, men are the ones who make the advances, do the pursuing, and get the ball rolling in the beginning stages of a new relationship. If there are fewer men going after dates or relationships with women, this could explain why fewer marriages are happening nationwide.
Reasons for Divorce
What are some of the chief reasons marriages go south and end in a less-than-ideal divorce? We could spend all day going over all the various reasons why partners choose to terminate their marriages. Still, several factors are most common in different divorce cases. We’ll cover the primary reasons below to give you a good idea of the problems leading to marriages falling apart.

Cheating
When a partner is caught cheating on their spouse, many times, this is a clear sign that the union wasn’t a good match and that it’s time to move on from the relationship. According to a 2022 study by Schoenberg Family Law Group, infidelity and unfaithfulness are the reason for 15-50% of divorces recorded in the United States.
However, not all marriages with a cheating partner result in a divorce. Research shows that 64% of these couples stay together, while roughly 30% proceed with divorce filings. Regardless of the direction these relationships go, we could safely say that cheating is responsible for close to a third of the divorces we see nowadays.

Money Issues
The Jimenez Law Firm found that anywhere from 20 to 40% of U.S. divorces come from financial hardships or the mismanagement of money.
Couples that are on the same page when it comes to their money and finances are statistically more likely to have healthy, thriving marriages because financial hardships don’t put a strain on the relationship. Money problems often exacerbate other marital issues, accelerating things in an unhappy direction.

Bad Communication
Married couples who are at odds with one another or don’t talk about their problems are also more likely to get divorced than couples who communicate well with one another and work through their issues. Couples who do their own thing and spend a lot of time away from one another can become like strangers, and relationships like this can pave the way toward a potential divorce too.
A Marcia Meditation Group study found that: “‘Communication problems’ is the most common factor that leads to divorce, at 65%. This was followed by couples’ ‘inability to resolve issues’ at 43%.”

Physical or Verbal Abuse
Unfortunately, many spouses out there choose to stay in a marriage where they are being physically or verbally abused. But many wise up if they discover their partner is not going to change and choose to get out of the situation via divorce.
Gabrielle Hartley Esq. of Divorce Law and Mediation covers the topic of abuse and divorce in 3 Kinds of Divorce Statistics You Can Learn From, where they discovered around 23.5% of all marriages end in divorce.
What Does the Future Hold?
With marriage and divorce rates up in the U.S. as of 2023, what does this mean for the future of our nation? It’s hard to tell because many things could happen that we might not be able to account for from our vantage point. Someone in 2010 might not have been able to anticipate the #MeToo Movement, much like someone in 2018 might not have been able to foresee what the world would look like beyond 2020!
However, we’ll make some sound predictions and projections of what we could see happening in the future based on the trends we’re seeing now with the marriage and divorce rates.
Predictions and Projections
Pew Research Center did some studies on online dating and relationships (“Key Findings on Online Dating in the US”) and they’re finding that most people are looking for true love or meaningful connections online, even when they’re using dating apps like Tinder or Bumble that have casual love or romance in mind. We can view online daters as a microcosm for the entire dating scene across the country and make some predictions and projections based on the findings of this Pew study.
Hypothetically, the number of marriages might be down in the U.S. because people aren’t willing to jump into marriage with just anyone like they might have done 10-15 years ago. While there might be fewer marriages overall across the country, there may be more quality marriages that form because today’s singles are looking for profound or meaningful relationships where there’s a quality connection. Those who choose to marry might be going with someone they know will be a good match, like a forever partner or soulmate.

Where do we see the volume of marriages going? If the numbers show a decline, we can only guess that the number of marriages will continue to drop until some catalyst causes more people to want to pursue marriage as an option. But what that catalyst is, we couldn’t tell you. People may see more successful, quality marriages around them and want the same for themselves. We don’t know.
Factors That May Influence Future Trends
American singles will gravitate toward quality connections in their marriages over the next several years. We’re already seeing evidence that more and more people are expressing interest in these relationships, and this trend of seeking quality will continue.
What is Influencing Future Trends?

As people wait longer before getting into someone serious (thus, forming relationships at a later age and a higher level of maturity), the number of quality marriages will rise, even if fewer exist nationwide.
We can’t help but believe that a generation of kids who grew up in divorced households want something better for their kids. So, we think we’ll continue to see a rise in quality marriages across the nation as a reaction to trauma sustained by divorces and separations.


Casual dating and short-term relationships with no direction have been the norm for decades now, and we’re going to see a shift from this way of operating on a larger scale. Singles are increasingly looking for connections and relationships with more meaning and direction.
Hot take here, but we feel that the world is becoming increasingly conservative and returning to old ideals and traditions. You can see current populist movements and people turning to religion in recent years. Not only will quality marriages continue to increase, but we may even see an increase in the volume of marriages across the U.S.